 FAO Map Catalog
Climatology, meteorology, atmosphere
Type of resources
Available actions
Topics
Keywords
Contact for the resource
Provided by
Years
Formats
Representation types
Update frequencies
status
Scale
Resolution
-
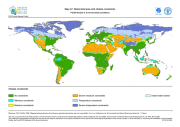
The FGGD climate constraints map is a global raster datalayer with a resolution of 5 arc-minutes. Each pixel contains a class value for the degree to which climate constrains agricultural production potential in the pixel area. The data are from FAO and IIASA, 2000, Global agro-ecological zones, as reported in FAO and IIASA, 2007, Mapping biophysical factors that influence agricultural production and rural vulnerability, by H. von Velthuizen et al.
-
Derived from the Global Agro-Ecological Zones Study, Food and Agriculture Organization of the United Nations (FAO), Land and Water Development Division (AGL) with the collaboration of the International Institute for Applied Systems Analysis (IIASA), 2000. Data averaged over a period of 37 years. Raster data-set has been exported as ASCII raster file type.
-

Map showing 35 lengths of growing period zones for the developing world. Digital version of "Major Climatic Divisions" derived from the Agro-Ecological Zones Project, made by FAO in 1978. Refer to World Soil Resources Report 48, Vol. 1 Methodology and Results for Africa; Vol. 2 Results for Southwest Asia; Vol. 3 Methodology and Results for South and Central America; Vol. 4 results for Near East.
-
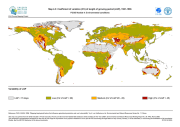
The FGGD CV of LGP map is a global raster datalayer with a resolution of 5 arc-minutes. Each pixel contains an average coefficient of variation of LGP for the pixel area over the period 1901-1996. The data are from FAO and IIASA, 2000, Global agro-ecological zones, as reported in FAO and IIASA, 2007, Mapping biophysical factors that influence agricultural production and rural vulnerability, by H. von Velthuizen et al.
-

The Climate Change ATLAS (CSIC) provides climate change information for essential climate variables generated from CMIP and CORDEX international initiatives. The data cubes for CMIP5 precipitation projectons provide gridded projections with a 2 deg spatial resolution as 1) relative differences (%) for three reference future periods (2021-2040, 2041-2060, 2080-2100) for RCP 2.6 an 8.5 scenarios with respect to the baseline reference period 1981-2010, and 2) relative differences (%) corresponding to three Global Warming Levels (1.5, 2 and 3 degC, obtained from the RCP8.5 scenario), with respect to preindustrial values (as characterized by the 1850-1900 period). Geospatial data from the ensemble of CMIP5 models represents the ensemble mean. The list of models used is available at https://github.com/SantanderMetGroup/ATLAS/tree/master/AtlasHub-inventory
-

The Climate Change ATLAS (CSIC) provides climate change information for essential climate variables generated from CMIP and CORDEX international initiatives. The data cubes for CMIP5 temperature projectons provide gridded projections with a 2 deg spatial resolution as 1) differences for three reference future periods (2021-2040, 2041-2060, 2080-2100) for RCP 2.6 an 8.5 scenarios with respect to the baseline reference period 1981-2010, and 2) differences corresponding to three Global Warming Levels (1.5, 2 and 3 degC, obtained from the RCP8.5 scenario), with respect to preindustrial values (as characterized by the 1850-1900 period). Geospatial data from the ensemble of CMIP5 models represents the ensemble mean. The list of models used is available at https://github.com/SantanderMetGroup/ATLAS/tree/master/AtlasHub-inventory
-
As part of the the World Bank's review of its rural development strategy, the Bank sought the assistance of the Food and Agriculture Organization of the United Nations (FAO) in evaluating how farming systems might change and adapt over the next thirty years. Amongst other objectives, the World Bank asked FAO to provide guidance on priorities for investment in food security, poverty reduction, and economic growth, and in particular to identify promising approaches and technologies that will contribute to these goals. The results of the study are summarized in a set of seven documents, comprising six regional reports and the global overview contained in this volume. This document, which synthesises the results of the six regional analyses as well as discussing global trends, cross-cutting issues and possible implementation modalities, presents an overview of the complete study. This document is supplemented by two case study reports of development issues of importance to farming systems globally.
-
Dataset averaged over a period of 37 years, based on Leemans, R. and Cramer, W., 1991. -The IIASA database for mean monthly values of temperature, precipitation and cloudiness on a global terrestrial grid-. Research Report RR-91-18. November 1991. International Institute of Applied Systems Analyses, Laxenburg, pp. 61. Raster data-set has been exported as ASCII raster file type.
-

Derived from the Global Agro-Ecological Zones Study, Food and Agriculture Organization of the United Nations (FAO), Land and Water Development Division (AGL) with the collaboration of the International Institute for Applied Systems Analysis (IIASA), 2000. Data averaged over a period of 37 years. Raster data-set has been exported as ASCII raster file type.